
Independent variable: Time
Dependent variable: Position
Controls: same object (cart), same slope of ramp, same surface material
*Controlling the variables - When doing multiple trials, use the same cart and let it run on the same ramp with the same slope. Since we shot one video of the cart running down the ramp and measured the position through Logger Pro, we did not need a specific method for controlling the variables.
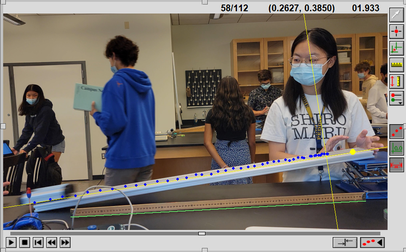
*Collecting the data - We collected the data through a video analysis on Logger Pro. Since a video is a series of pictures separated by a very small time interval, we used them to create precise strobe diagrams. After importing the video, set the origin as the head of the cart, placed at the top of the ramp. Then, rotate the axes so they align with the path of motion (the ramp). Use the meter stick on the video to set the scale. Using the "Add points" tool, click on the head of the cart to add a data point and advance the video by one frame. Continue adding data points until the cart is off the ramp in the video. Logger Pro created a table with columns for time and position (for both x (horizontal) and y (vertical)). The time interval is approximately 0.03 seconds, since there are 30 frames in one second.
PROCEDURE
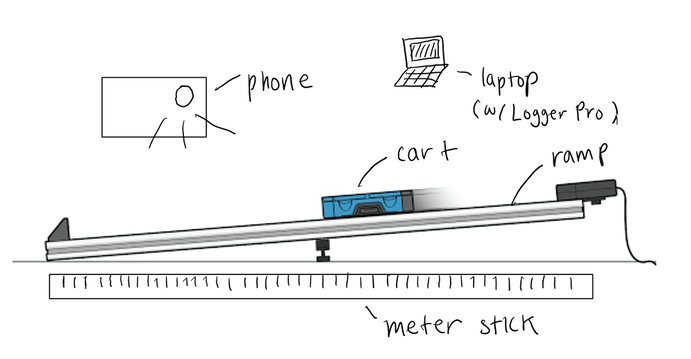
1. Place the phone on a stable object so that it doesn't move. Make sure it captures both the ramp and the meter stick without distortion.
2. Place the cart on top of the ramp, having its tail at the end. Place a meter stick on a flat surface for distance reference.
3. Start the video. The person holding the cart let go of the cart so that it runs down the ramp.
4. Stop the cart when the head of the cart leaves the ramp. Stop recording.
5. Import the video to Logger Pro and collect the data as described above.
Labeled Diagram
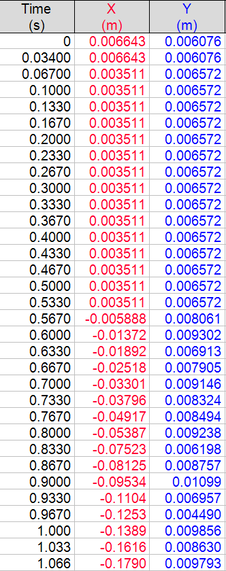
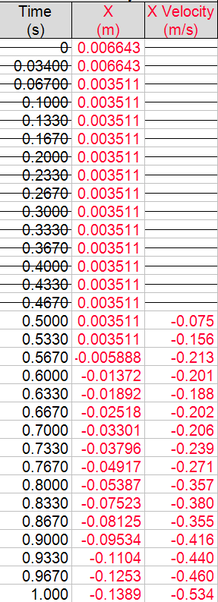
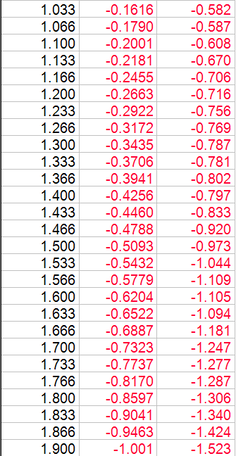
Recorded Raw Data
|
|
*Possible uncertainties: We're assuming that we are clicking on the same part of the buggy every time when adding the data points. This leads to a possibility of judgement errors, which would influence the x and y position of the cart.
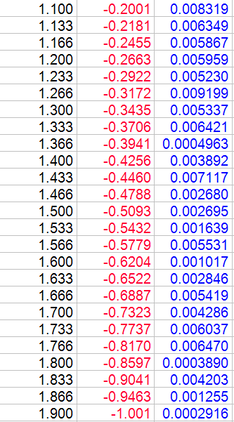
Processed Raw Data
Processed Raw Data
|
|
We used the X values (horizontal motion) to record the position of the cart. Therefore, the Y values (vertical motion) was not necessary. I also deleted a few data points in the beginning since the person didn't release the cart for the first 0.5 seconds. As shown in the X values, the cart stays in the same position (0.003511m) for that 0.5 seconds. Moreover, Logger Pro calculated the instantaneous velocity of the cart at each point of time. This is also based on the X values, the horizontal motion of the cart.
Graphical Analysis
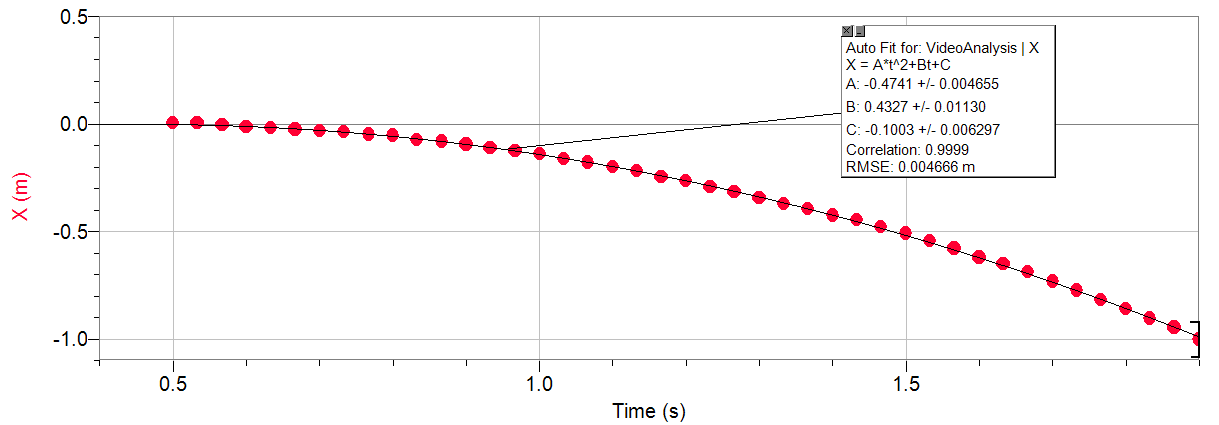
This is a position-time graph which shows the relationship between time and displacement of the cart. The position of the cart is negative, since in the video, the cart is moving to the left, which would have been acknowledged as moving in the opposite direction. The quadratic model tells us that as time increases, the distance travelled by the cart increases. Although the change in position (the displacement) is negative, distance travelled by the object is still positive (since distance is the absolute value of displacement). Also, the slope of the graph, which signifies the velocity, gets steeper as time increases. This tells us that the cart is speeding up as it goes down the ramp. The y-intercept, which signifies the initial position of the cart, is -0.1003m. However, the initial position should be 0, since we placed the cart at the origin.
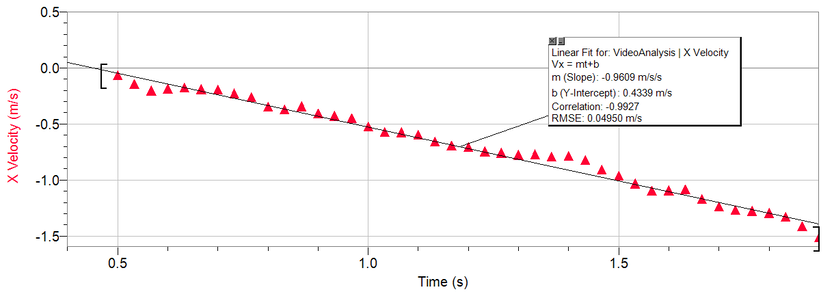
This is a velocity-time graph which shows the relationship between time and the velocity of the cart. As time increases, the velocity decreases. The velocity is negative because the cart is moving in an opposite direction (to the left). The magnitude of the velocity - speed - is increasing as time increases. The slope of the graph is -0.9609m/s/s. As time increases by 1 second, the velocity is decreasing by 0.9609m/s. The linear model indicates that the change in velocity - acceleration - is constant. The cart has a uniform acceleration of -0.9609m/s/s. The y-intercept - the initial velocity - is 0.4339m/s. This also should have been 0, since the first point I clicked on was just before the cart started to move.
CONCLUSION
As time increases, the position of the cart on a ramp decreases. More importantly, the change in the position of the cart increases for each and every second - the cart is accelerating. The slope of the position-time graph signifies velocity. The slope gets steeper as time increases, indicating that the cart is speeding up. The slope of the velocity-time graph signifies acceleration. The slope of this graph is constant as -0.9609, which means that the as time increases by 1 second, the velocity is decreasing by 0.9609m/s. It is important to note that negative acceleration does not necessarily mean deceleration. In this case, acceleration is negative because the cart is moving to the left, which is recognized by the program as the opposite direction. The cart is still speeding up. Both graphs show that as time increases, the position of the cart decreases in a increasing rate - the cart is accelerating.
Through this lab, we were able to reach a general model for velocity graphs:
v final = a*Δt + v initial
Acceleration is calculated by (change in velocity)/Δt. If we multiply the change in time to acceleration, we are able to get the total change in velocity. This is used to find the final velocity of the moving object. As the magnitude of the acceleration increases, the slope of the velocity-time graph gets steeper. This is true for both signs, (+) and (-). In this lab, we saw that the velocity-time graph of the cart had a constant slope of -0.9609. This indicates that the cart is accelerating at a rate of -0.9609m/s/s.
EVALUATION
Although I have a high level of confidence on the lab results, there were a few sources of uncertainty. First, we had to click the exact same part of the buggy to collect the data points. Some judgement error might have happened while we were selecting the points by hand. Moreover, we can't ignore the possibility of the images being distorted. When something is filmed by a device, it is normal to have a distortion in some parts of the scene. For improvement, I think we could have used a longer ramp to collect more data points for the results. This way, the cart would take a larger amount of time to slide down the ramp, and there would be more frames to collect data points from.
Although I have a high level of confidence on the lab results, there were a few sources of uncertainty. First, we had to click the exact same part of the buggy to collect the data points. Some judgement error might have happened while we were selecting the points by hand. Moreover, we can't ignore the possibility of the images being distorted. When something is filmed by a device, it is normal to have a distortion in some parts of the scene. For improvement, I think we could have used a longer ramp to collect more data points for the results. This way, the cart would take a larger amount of time to slide down the ramp, and there would be more frames to collect data points from.
