
Research Question 1: How does the acceleration of an object depend on the net force acting on it?
Independent variable: net force
Independent variable: net force
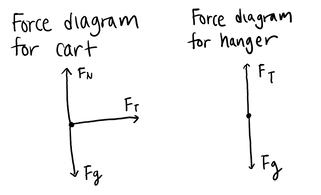
1) Newton's 1st law says that only unbalanced forces change motion of an object. The force of gravity by earth on cart is balanced with the normal force by track on cart.
2) Newton's 3rd law says forces are interactions that act equally and in opposite directions on interacting objects. The force of tension is the same force acting on two object. It acts within the cart-hanger system (an internal force) equally and opposite in direction and can't change the motion of the system.
--> The force of gravity by earth on hanger (mass*gravitational field strength) is the only force that can cause a change in the motion.
Dependent variable: acceleration
Controls: total mass (hanger + cart)
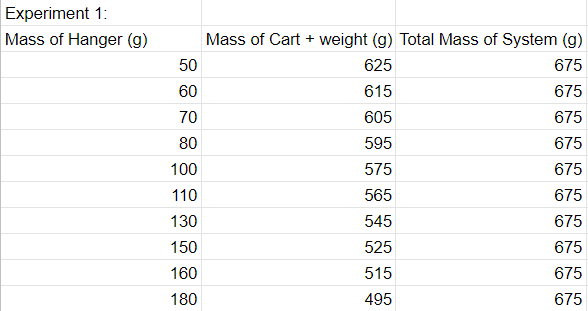
*Controlling the variables: We had to keep the total mass the same. More mass of an object means more inertia - the resistance to change in motion of an object. Therefore, the change in total mass will affect the acceleration of an object. To change the net force without changing the total mass, we increased the mass of hanger and decreased the mass of cart when collecting the data.
Controls: total mass (hanger + cart)
*Controlling the variables: We had to keep the total mass the same. More mass of an object means more inertia - the resistance to change in motion of an object. Therefore, the change in total mass will affect the acceleration of an object. To change the net force without changing the total mass, we increased the mass of hanger and decreased the mass of cart when collecting the data.
|
Collecting the data...
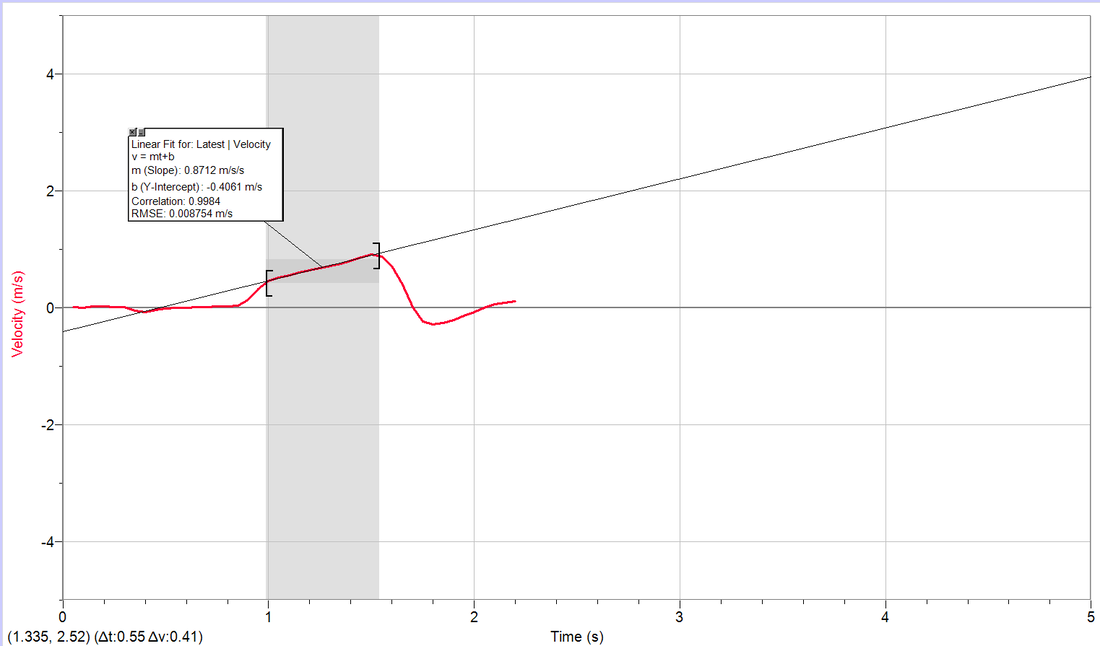
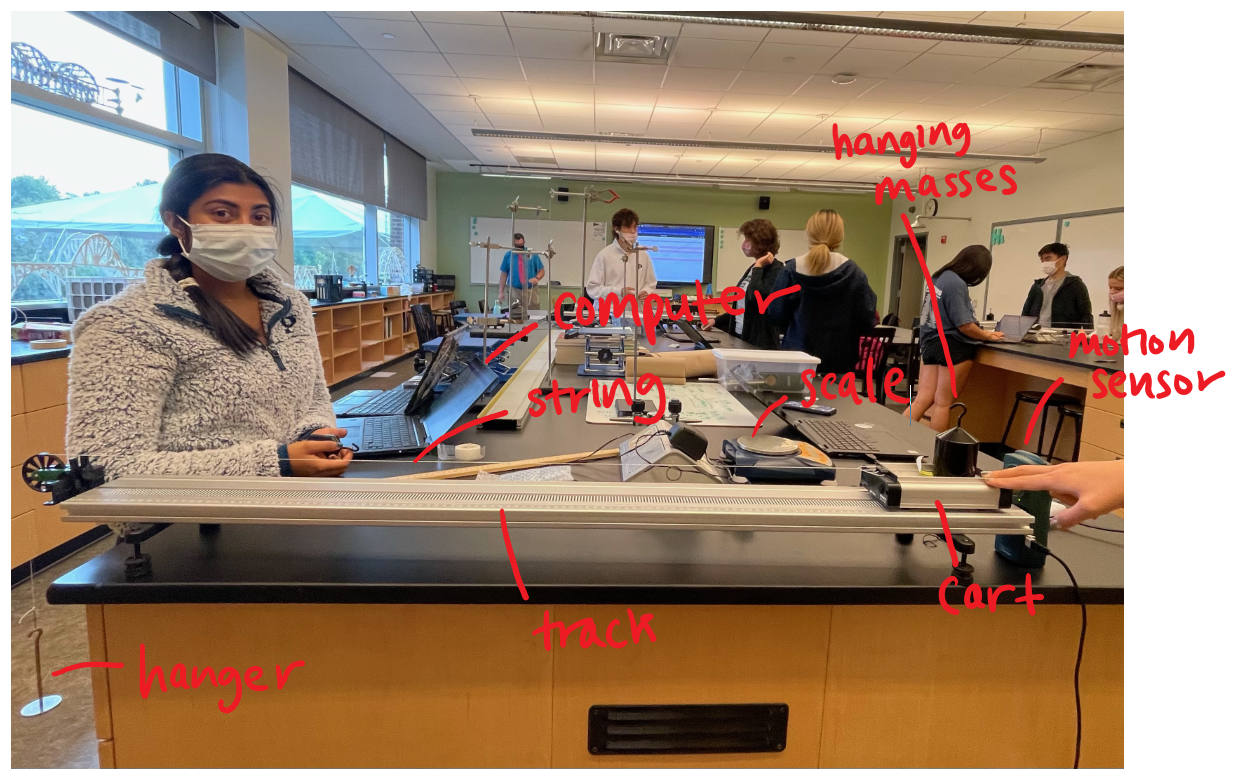
We connected a motion sensor to LoggerPro on our computer to create a velocity-time graph for each trial. We then analyzed the slope of the graphs to find the acceleration. The image in the left shows how we calculated the acceleration. We selected the linear part of the graph to measure the slope since that is when the cart is in motion, accelerating. After collecting the acceleration for each trial and the net force acting on the system, we generated a final acceleration-net force graph to see the relationship between the two. |
Procedures
1. Measure the total mass of the system (cart + hanger + hanging masses)
2. Connect a motion sensor to LoggerPro.
3. Record the total mass of the hanger.
4. Activate the motion sensor and release the cart from rest. Stop it before the hanger hits the ground.
5. Record the acceleration by calculating the slope of the velocity-time graph.
6. Repeat step 3-5 for different hanging masses.
Labeled Diagram
Recorded Raw Data
+ 10 velocity-time graphs created by the motion sensor & LoggerPro (we didn't take a screenshot of every single graph)
Processed Raw Data
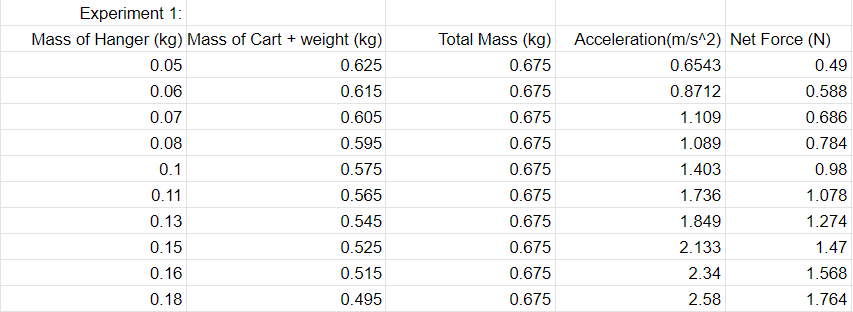
*We changed the units of the first three columns into kilograms
*We selected the linear parts of the velocity-time graphs and analyzed its slopes to record the acceleration
*To calculate the net force - the force of gravity acting on the hanger - we multiplied the gravitational field strength (9.8N/kg) to the mass of the hanger
**Possible uncertainty : Since we select the linear part of the graph by hand to calculate the acceleration, there is a possibility of judgement errors, which would influence the acceleration.
Graphical Analysis
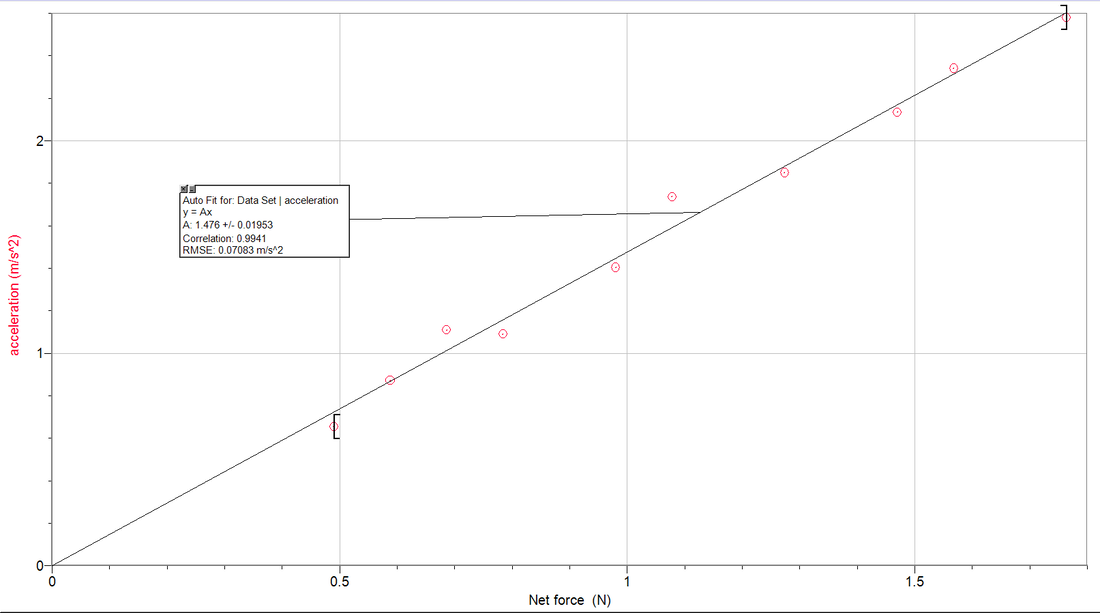
We used proportional fit to figure out the best-fit line. According to the graph, acceleration is directly proportional to net force. The graph has a constant positive slope of 1.476m/s/s/N. For every Newton of increase in net force, the acceleration increases by 1.476m/s/s. Moreover, the y-intercept of every proportional model is 0. This applies to this experiment because acceleration is zero when net force is zero. According to the law of inertia, an object is at rest or moving in a constant speed when the forces acting upon it are balanced, or, when the net force is zero. Therefore, as there are no force acting on the cart, the acceleration of the object is zero.
Research Question 2: How does the acceleration of an object depend on the mass of it?
Independent variable: total mass
Dependent variable: acceleration
Controls: net force (∑F)
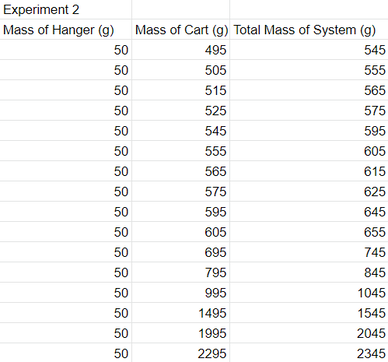
*Controlling the variables: We have to keep the net force constant since it will affect the acceleration. Since the net force is determined by the amount of mass added to the hanger, we should keep the mass of the hanger constant. To change the total mass without changing the net force, we increased the mass of the cart while keeping the mass of hanger constant.
*We used the same method to collect the data except that the final graph we generated was a total mass-acceleration graph.
Procedures
1. Measure the mass of the hanger.
2. Connect a motion sensor to LoggerPro.
3. Record the total mass of the system (cart + hanger + hanging masses).
4. Activate the motion sensor and release the cart from rest. Stop it before the hanger hits the ground.
5. Record the acceleration by calculating the slope of the velocity-time graph.
6. Repeat step 3-5 for different system masses.
Recorded Raw Data
Independent variable: total mass
Dependent variable: acceleration
Controls: net force (∑F)
*Controlling the variables: We have to keep the net force constant since it will affect the acceleration. Since the net force is determined by the amount of mass added to the hanger, we should keep the mass of the hanger constant. To change the total mass without changing the net force, we increased the mass of the cart while keeping the mass of hanger constant.
*We used the same method to collect the data except that the final graph we generated was a total mass-acceleration graph.
Procedures
1. Measure the mass of the hanger.
2. Connect a motion sensor to LoggerPro.
3. Record the total mass of the system (cart + hanger + hanging masses).
4. Activate the motion sensor and release the cart from rest. Stop it before the hanger hits the ground.
5. Record the acceleration by calculating the slope of the velocity-time graph.
6. Repeat step 3-5 for different system masses.
Recorded Raw Data
+ 10 velocity-time graphs created by the motion sensor & LoggerPro (we didn't take a screenshot of every single graph)
Processed Raw Data
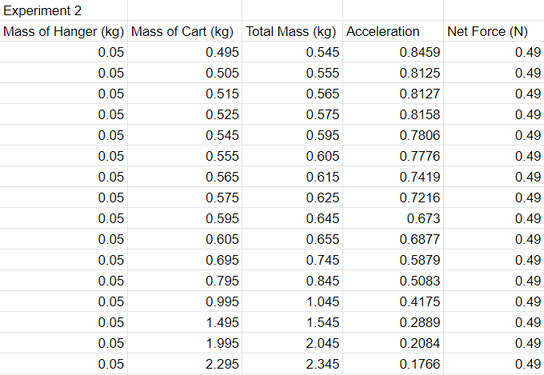
*We changed the units of the first three columns from grams to kilograms
*We selected the linear parts of the velocity-time graphs and analyzed its slopes to record the acceleration
*To calculate the net force - the force of gravity acting on the hanger - we multiplied the gravitational field strength (9.8N/kg) to the mass of the hanger
**Possible uncertainty : Since we select the linear part of the graph by hand to calculate the acceleration, there is a possibility of judgement errors, which would influence the acceleration.
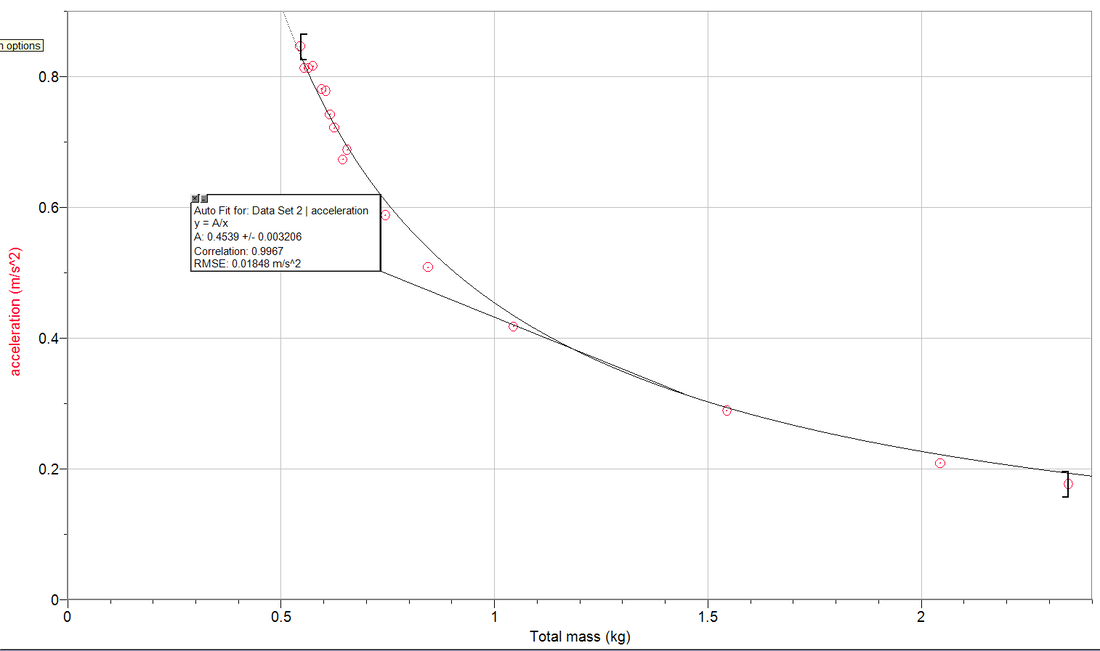
We used an inverse model to find the best-fit curve. The graph shows that acceleration is inversely proportional to total mass. The slope of the graph - the rate of change in acceleration - decreases as total mass increases, meaning that as the total mass of the system increases, the acceleration decreases by less and less. The y-intercept does not exist because it is impossible for mass to be 0kg; every matter, by definition, has mass.
Conclusion
Acceleration is directly proportional to net force and inversely proportional to total mass. As shown in the graph for experiment 1, the slope of the acceleration-net force graph is constant and positive; this indicates that more net force leads to more acceleration. For every Newton of increase in net force, the acceleration increases by 1.476m/s/s. The equation for the model is acceleration = A*∑F, "A" being a constant. When we look at the graph for experiment 2, acceleration and total mass has an inverse relationship. As total mass increases, acceleration decreases. The slope gets shallower, meaning acceleration decreases by less and less as total mass increases. The equation for this model is acceleration = A/total mass, "A" being a constant.
Through this lab, we were able to derive Newton's Second Law of motion:
∑F=m*a (m=mass, a=acceleration)
Newton's Second Law of motion connects acceleration with force and mass. As proven by the two experiments, acceleration increases as the net force acting upon it increases, and decreases as the mass of an object increases. Through this equation, we are also able to derive the constant A for the both equations.
1) acceleration = (1/mass)*∑F
2) acceleration = ∑F*total mass
Evaluation
I have a medium-high level of confidence for our lab results. Firstly, as I have mentioned above, there is a possibility of judgement errors when selecting the linear parts of the velocity-time graphs. This might have affected the data collection for acceleration. Secondly, since we didn't have enough time, we weren't able to collect a wide range of data. To improve, we could have used heavier hanging masses to collect a wider range of data for both experiments. We also could have used a longer track so that there is enough time for the cart to accelerate before we stop it.
