
Location at a specific time: POSITION - changes depending on time
How location changes over the course of a trip:
Distance - how far you've gone, regardless of direction (always positive)
Displacement - overall change in position (x final - x initial) including direction
*scalars - quantities that only have a magnitude
*vector - quantities that have both a magnitude and a direction (ex. 55mph west)
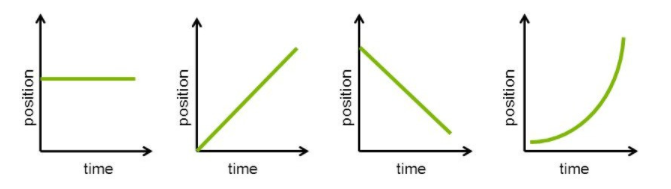
*SLOPE of position vs. time graph = VELOCITY over that interval of time
* steeper the slope, higher the speed (magnitude of velocity)
1) slope = velocity = 0, object at rest
2) slope > 0, velocity is constant, positive
3) slope < 0, velocity is constant, negative
4) slope & velocity not constant - slope getting steeper - object is accelerating
* steeper the slope, higher the speed (magnitude of velocity)
1) slope = velocity = 0, object at rest
2) slope > 0, velocity is constant, positive
3) slope < 0, velocity is constant, negative
4) slope & velocity not constant - slope getting steeper - object is accelerating
*area under velocity vs. time graph = displacement / change in position of the object
*sum of area with signs = displacement, w/out signs = distance (always positive)
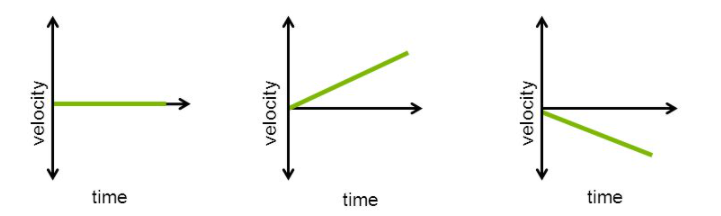
*SLOPE of velocity vs. time graph = ACCELERATION over that interval of time
*y - intercept = initial velocity
1) line along x-axis - no displacement (object at rest)
2) line above x-axis, positive displacement
positive slope: positive acceleration (constant)
3) line below x-axis, negative displacement (opposite direction)
negative slope: negative acceleration (constant)
*sum of area with signs = displacement, w/out signs = distance (always positive)
*SLOPE of velocity vs. time graph = ACCELERATION over that interval of time
*y - intercept = initial velocity
1) line along x-axis - no displacement (object at rest)
2) line above x-axis, positive displacement
positive slope: positive acceleration (constant)
3) line below x-axis, negative displacement (opposite direction)
negative slope: negative acceleration (constant)
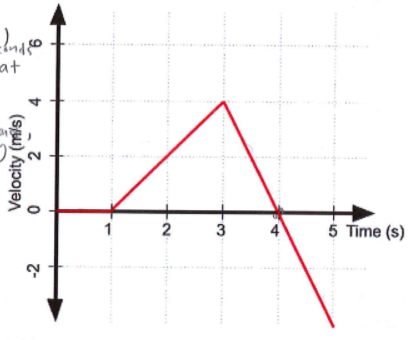
ex) Interpreting velocity - time graphs
0<t<1 : velocity is 0 = object at rest
1<t<3 : velocity increases & reaches 2m/s @ t=3 --> object moves forward (6m), speeds up
3<t<4 : velocity decreases from 2m/s to 0m/s --> object still moves forward (2m), but slows down
4<t<5 : velocity decreases from 0m/s to -4m/s --> object changes direction and moves back towards the starting point (2m), speeds up as it goes
Connecting representations of motion: x-t graphs, v-t graphs, a-t graphs
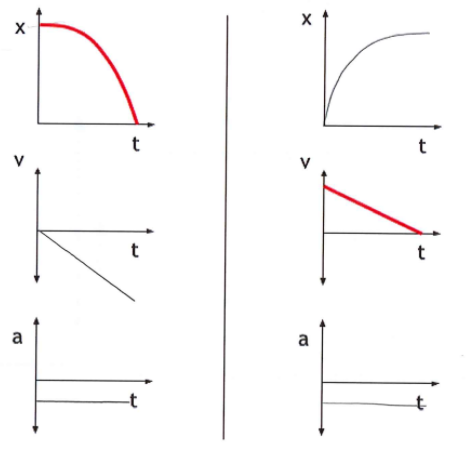
1) x-t graph shows the position of an object at a given time
- for uniform acceleration, the curve is parabolic
- slope of the tangent at any point = velocity of the object at that point
2) v-t graph shows velocity of an object at a given time
- area under the curve gives the displacement of the object at a given time interval
- for uniformly accelerating motion, the graph is given as a straight line (positive or negative)
- slope of a tangent at any point = acceleration of the object at that point
3) a-t graphs shows acceleration at a particular time
- area under the curve gives the change in velocity at a given time interval
- for uniformly accelerating motion, the graph is a straight line parallel to the t axis
Strobe diagrams: uses dots to represent the position and time of an object each second
ex) free fall
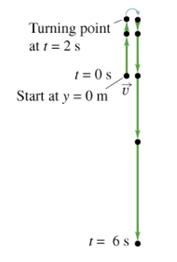
Motion Diagram of the freefall of a stone
- magnitude of the arrow indicates speed
- shows acceleration due to gravity (9.8m/s^2)
- velocity decreasing in a uniform rate, due to uniform velocity
- velocity = 0 @ t=2
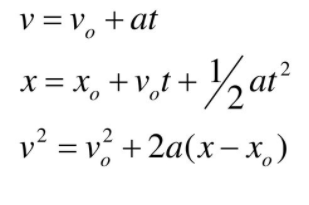
Kinematic Equations
*used when acceleration is constant
1) equation / model for a velocity-time graph
2) equation / model for a position-time graph
3) no Δt info needed
Projectile Motion
Projectile : an object in the air
1) x-direction (horizontal motion)
- acceleration = 0
- velocity = (Δx/Δt), constant
2) y-direction (vertical motion)
- acceleration = -g = -9.8m/s^2
uniformly accelerated motion
*g is positive! (9.8m/s^2)
